Evaporation source
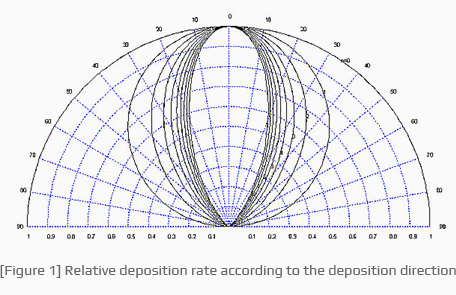
Evaporation distribution is known to have a cosine function distribution
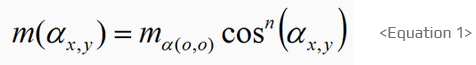
as in [Figure 1] and < Equation 1 > proposed by L. Holland and W. Steckelmacher [1]. Holland, W.
In < Equation 1 >, m() is the amount of material evaporated at an arbitrary angle
from the vertical direction of the evaporation source, in which m0 is the amount evaporated when 0.
In the same equation, n is a constant that varies depending on the type of point evaporation source
and evaporation conditions, representing the degree of anisotropy of the evaporated material.
-
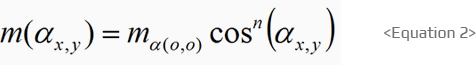
In the case of using a point evaporation source, since the deposition rate and the deposition form vary depending on the n value,
the thickness and deposition efficiency of the deposited thin film can be estimated if the n value can be accurately obtained.
This value of n can be obtained by experimentally measuring the thickness distribution of the thin film deposited
at the point evaporation source by using < Equation 2 > below. -
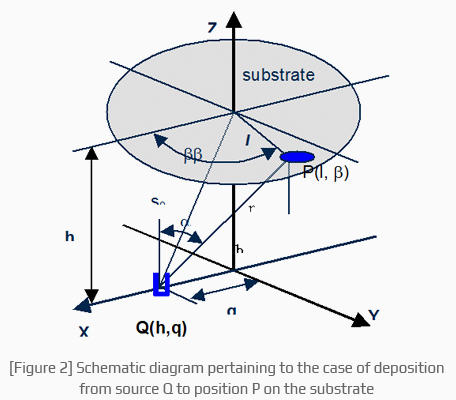
If the n value of the point evaporation source and location Q of the evaporation source are given as in [Figure 2],
thickness at deposition surface P is expressed as a cosine function.
In [Figure 2], l and β are the distance from the center of the substrate
and the angle between the center of the substrate and the straight lines of the evaporation source and measurement point, respectively.
h, q, and b are the height of the substrate
and the evaporation source, the distance from the center, and the tilting angle with the evaporation source, respectively.
In [Figure 2], the arbitrary position on the substrate
and the thickness of the thin film at P are expressed in < Equation 3 >. -
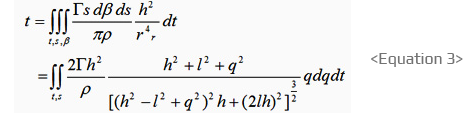
In < Equation 3 >, thickness t can be expressed as l, h, and q, wherein the solution can be obtained through computer simulation
since there is no general solution to this equation.
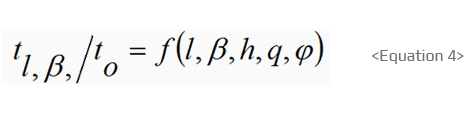
If < Equation 3 > on the thickness of the thin film is expressed as relative thickness expression t(l, B)/t0, it shall be the same as < Equation 4 >. -
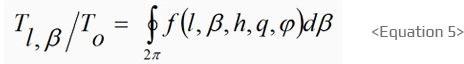
In the case of using a point evaporation source, thickness uniformity can be obtained even over a large area
by rotating the substrate since the area that can secure uniformity of the thin film thickness is small.
Here, the thickness distribution is expressed as < Equation 5 >.
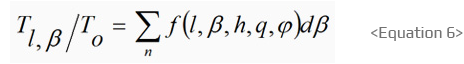
It can also be expressed as < Equation 6 > when a linear evaporation source or several point evaporation sources are used.
In < Equation 5 > and < Equation 6 >, T(l.) is the thickness of the thin film at a given distance l and angle on the substrate, and To is the thickness when l and β are 0 each. -
Based on the deposition theory above, the foregoing shows
the simulation of the deposition uniformity of the point evaporation source. -
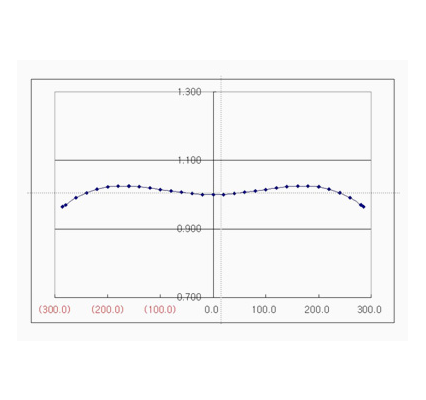
In this simulation, the distance between the substrate and the evaporation source was set to 530 mm,
the n factor was 4, and the distance (q) between the evaporation source and the center of the substrate was 310 mm and the substrate was rotated.
At this time, the deposition simulation uniformity was observed to have exhibited results of less than ± 5%.